All Commodity Volume (ACV)
What is All Commodity Volume (ACV)?
ACV is the total sales (in dollars) for a given retailer within a specific market. This measurement includes all products sold by the store, rather than breaking them down by category.
ACV is often referred to as %ACV for CPG brands, which offers a weighted value for products in specific stores. By looking at both the total ACV and %ACV, manufacturers can better understand the breadth of their product distribution.
How is All Commodity Volume (ACV) Calculated?
Standard ACV is just the total dollar sales for a particular store. So, if a retailer sells $50 million worth of products in a week, that is its ACV.
Percent ACV is calculated differently, though. Rather than looking at one individual outlet, brands will look at all the stores within the region to determine how well their products are distributed. In that case, you divide the ACV of the stores in which your products are sold by the total number of stores in that market.
For example, let’s say that there are four outlets in the city and your product is sold in three of them. Each retailer’s ACV looks like this:
- Store 1: $40M
- Store 2: $30M
- Store 3: $60M
- Store 4: $50M
Since your products are in three of the four stores, your distribution is technically 75 percent (3 divided by 4). However, %ACV weights the calculation based on the total sales for each store. The formula looks like this:
Total ACV For Stores Carrying Your Product/Total ACV For All Stores
Let’s say that your product is sold in stores 1, 2, and 4. Here’s what the calculation looks like:
40+30+50 (120) / 40+30+60+50 (180) = 67%
Because store three has the highest ACV and your products aren’t sold there, you have less distribution overall. If you sold in stores 1, 3, and 4, your %ACV would be 83%.
Why is All Commodity Volume (ACV) Important for CPG Brands?
As you can see, there is a pretty big difference between your %ACV when comparing product distribution in low-performing stores compared to high-performing stores. In our example above, it’s actually better to sell in store three because it has the highest sales.
Overall, knowing your %ACV can tell you whether your distribution is evenly weighted or not and can let you know which stores offer the best potential for increased sales.
Benefits of ACV
When looking at a particular market, ACV can offer better insight than other metrics, such as physical size, location, and shelf space. For example, one store may have tons of room for your products, but it has fewer sales than a smaller retailer. ACV allows you to weigh each outlet so that you can focus on higher-quality retailers.
Example of ACV
Usually, you want to look at ACV for specific products. Since ACV is calculated weekly, you’ll need to look at multiple weeks to get an average percentage. Here’s an example:
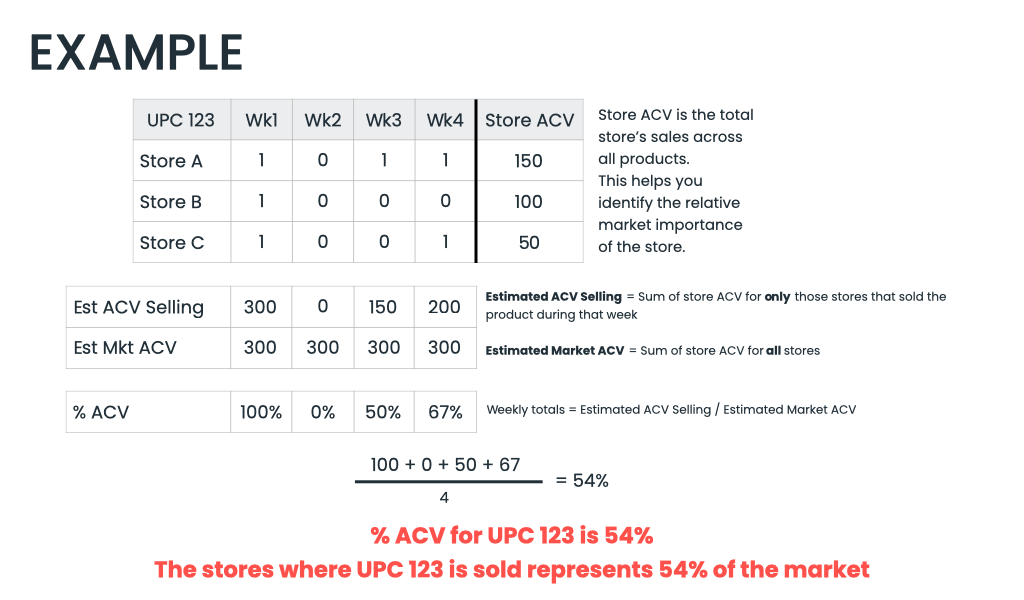
The total ACV for all three stores is 300 per week. During week one, Product 123 was sold in each store for a total %ACV of 100. During week two, the product wasn’t sold in any store, for a %ACV of zero. Week three saw a %ACV of 50, and week four was 67%.
Overall, for the entire month, the product’s %ACV was 54 (217/4).
How to Use ACV For Your Business
As we mentioned, this metric helps you qualify retailers so that you can focus your attention on the ones that matter most to your bottom line. If one store has significantly higher sales than another, it’s better to promote your products there than at a retailer with a much lower ACV. With this data, you can align your sales, marketing, and manufacturing teams to target high-quality storefronts.
Byzzer is a self-serve business intelligence platform that gives small CPG manufacturers the power of NielsenIQ data.